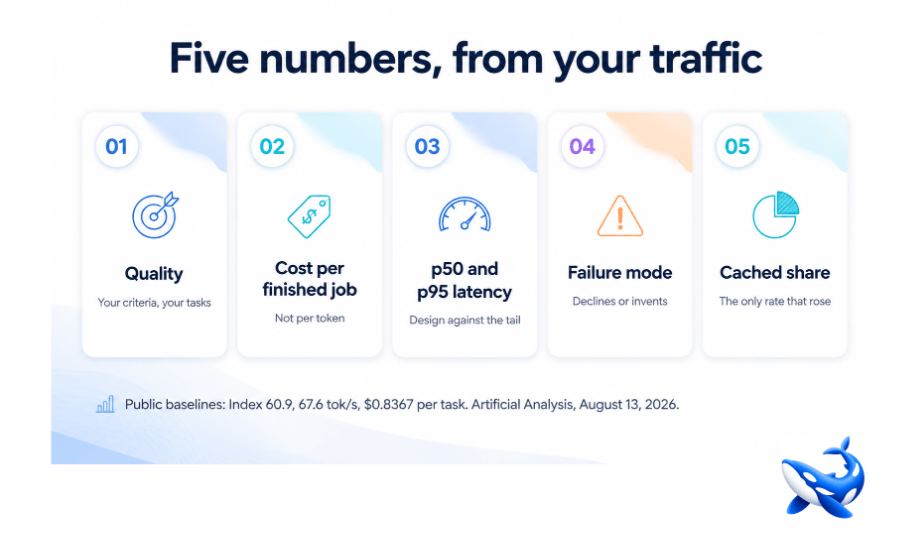

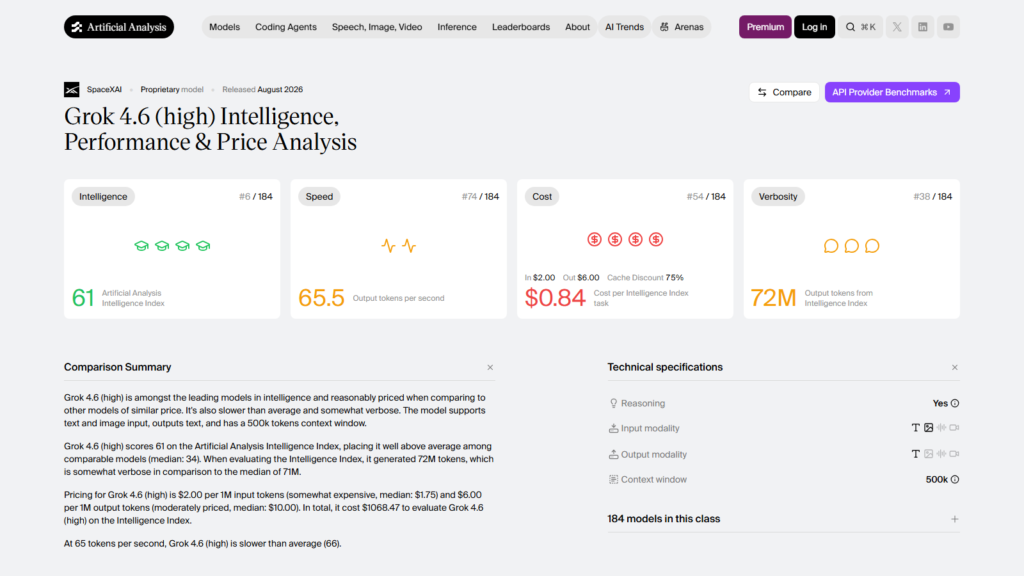
Public benchmarks tell you Grok 4.6 scores 60.9 and runs at 67.6 tokens per second. They cannot tell you whether it is better than Grok 4.5 *on your tasks*, what it will cost *your* workload, or how it fails in *your* domain. Those take twenty to fifty real tasks and about an afternoon, and the interface is unchanged so there is nothing to build first. Our Grok 4.6 release notes track what shipped, when, and what it replaced.
Here are the five numbers worth collecting, and the published baselines to compare them against.
The baselines
Artificial Analysis, checked August 13, 2026, configuration “high”:
| Grok 4.5 | Grok 4.6 | |
| Intelligence Index | 55.8 | 60.9 |
| Median output speed | 56.9 tok/s | 67.6 tok/s |
| Answer time | 8.79 s | 7.40 s |
| AA-Omniscience | 25.3 | 30.5 |
| Cost per index task | — | $0.8367 |
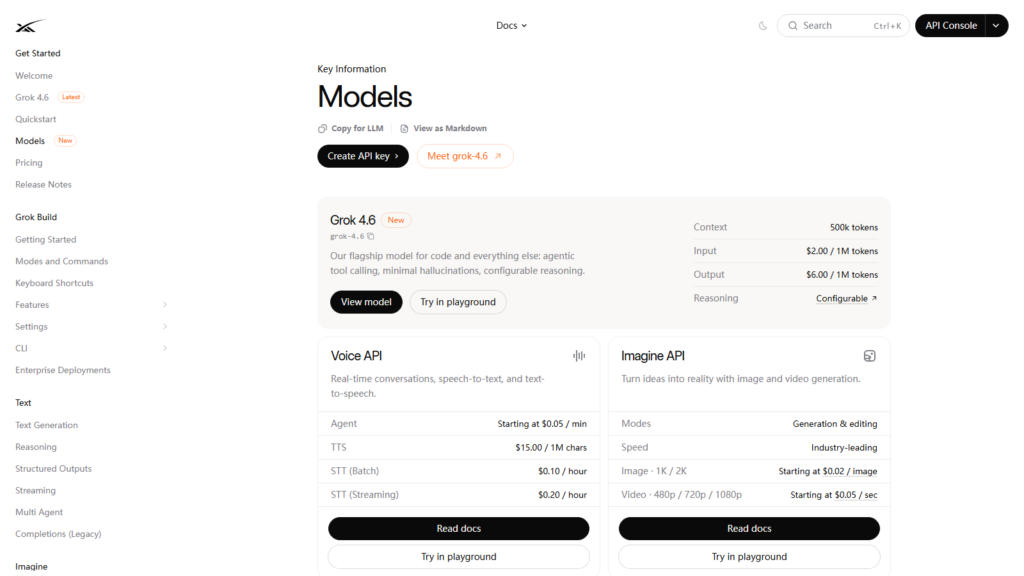
And from xAI’s own documentation: $2.00 / $6.00 per million tokens under 200,000, $4.00 / $12.00 at or above, cached input $0.50 / $1.00 (up from 4.5’s $0.30 / $0.60), context 500k, knowledge cutoff February 1, 2026.
Use these as reference points, not as answers.
1. Quality, on your own criteria
Twenty to fifty tasks with known-good outcomes, drawn from real traffic — and weighted toward the hard end of your distribution rather than the average. A five-point index gain shows up at the difficult end; the middle will look identical on both models and tell you nothing.
Score against what your product needs, which is rarely what a composite measures. And hold the effort level constant across both models, then write down which one you used. Comparisons across configurations are the most common way to produce a result that means nothing, including six months from now when you re-read your own notes.
2. Cost per finished job, not per token
The rate card is identical between 4.5 and 4.6, so per-token spend will look unchanged while your real cost moves with how much the new model thinks. Reasoning tokens bill as output at $6.00 per million.
Instrument at the level of a completed unit of work — a resolved ticket, a reviewed document, a merged patch. That number compares across models, across vendors and across time. Sanity-check it against the published $0.8367; for reference, GPT-5.6 Sol scores an identical 60.9 at $1.2312 and Claude Opus 5 scores 63.1 at $2.3369.
3. p50 and p95 latency, end to end
Not the model’s generation rate — the time from request to usable result in your system, including tool calls, retrieval and network.
Design against p95. Users experience the tail, and in many production systems the model is not the dominant term at all. If generation is 20% of your latency, a 19% throughput improvement moves your p95 by about 4%, and optimising it further is a poor use of a week. Measure before you assume.
4. Failure mode: declines or invents
The measurement most teams skip and the one that most often changes a decision.
Write twenty questions your system would plausibly receive that the model shouldn’t be able to answer — things after February 1, 2026, internal to your organisation, or specific enough to sit outside general training. Then record which of three things happens: it declines, it hedges appropriately, or it produces a confident wrong answer.
Count the third category. That is what Omniscience measures, and Grok 4.6’s 30.5 — up from 25.3 — sits below Claude Opus 5’s 37.1 and Claude Fable 5’s 43.3. Whether that gap matters is a question about your domain, and this test answers it in twenty minutes.
Then run the same twenty with your retrieval layer enabled. The delta between the two runs is the honest measure of your exposure, and for a well-built pipeline it is usually much smaller than the raw scores suggest.
5. Your cached-token share
The one number that can make this upgrade cost more.
Cached input went from $0.30 / $0.60 to $0.50 / $1.00 — a 67% increase, and the only cell on the rate card that changed. A workload built around a long replayed prefix pays that increase on its largest input line; one that never hits cache is unaffected.
If your share is high and your generation is light, run both models for a week and compare invoices. No amount of reasoning from the published table settles this; only the bill does.
While you have the data open, also pull the share of requests at or above 200,000 tokens. Those bill at double rate on both models, and the average request size will never reveal it.
See also: 4 Ways Technology Has Transformed Modern Filmmaking
What to write down
The output of a first week should be a short record, not a feeling:
• Model identifier and effort level used, for both models
• Quality result on N tasks, by your criteria, with the hard-tail subset called out separately
• Cost per completed job, both models
• p50 and p95 end-to-end, both models
• Fabrication count on twenty unanswerable questions, with and without retrieval
• Cached-token share and the share of requests above 200,000 tokens
That document is worth more than the decision it produces, because the next model lands in a few weeks and you will run this again. Teams that keep the record evaluate in an afternoon; teams that don’t start from scratch every time.
Keeping the model behind a configuration value rather than a code path is what makes the whole exercise cheap — and it is the same property that makes acting on the result cheap.
The takeaway
A first-week evaluation of Grok 4.6 needs five numbers from your own traffic: quality on twenty to fifty real tasks weighted toward the hard end, cost per completed job rather than per token, p50 and p95 end-to-end latency, the fabrication count on twenty questions the model shouldn’t be able to answer, and your cached-token share — the only figure that can make this upgrade more expensive, since cached input rose 67% while everything else on the rate card stayed identical. Compare each against the published baselines of 60.9, 67.6 tokens per second and $0.8367 per task, hold the effort level constant, and write the result down for the next model.
Sourcing note: Intelligence Index, output speed, answer time, Omniscience and cost per index task are from Artificial Analysis, checked August 13, 2026, at the configurations labelled; Grok figures are configuration “high”. Per-token prices, cached-input rates, tier thresholds, the context window and the knowledge cutoff are from xAI’s own model documentation, checked the same day. The latency arithmetic is illustrative and depends entirely on individual system composition.